Benchmark
Benchmark tools and configurations
- Testing by Pegasus Java client drive in YCSB
- Set
requestdistribution=zipfian, which means the discrete probability distribution whose rank-frequency distribution is an inverse power law relation, see Zipfian distribution.
Benchmark result explanation
- Case: The cases are read-only testing
Read, write only testingWrite, and read and write combined testingRead & Write - Threads: written in the form of
a * b, wherearepresents the number of client instances (i.e., the number of instances YCSB runs on), andbrepresents the number of threads (i.e., the value of thethreadcountoptions in YCSB) - RW Ratio: Read / write operation ratio, which is the ratio of
readpromotiontoupdatepromotionorinsertpromotionin YCSB options - Duration: Total testing time in hours
- R-QPS: Read operations per second
- R-AVG-Lat, R-P99-Lat, R-P999-Lat: average, P99, P999 latency of read operations, in microseconds
- W-QPS: Write operations per second
- W-AVG-Lat, W-P99-Lat, W-P999-Lat: average, P99, P999 latency of write operations, in microseconds
Benchmark on different versions
2.4.0
Test environment
Hardware
- CPU: Intel® Xeon® Silver 4210 * 2 2.20 GHz / 3.20 GHz
- Memory: 128 GB
- Disk: SSD 480 GB * 8
- Network card: Bandwidth 10 Gb
Cluster scale
- The count of replica server nodes: 5
- The partitions count of the test table: 64
Benchmark results
- Single data size: 1KB
| Case | threads | Read/Write | R-QPS | R-AVG-Lat | R-P99-Lat | W-QPS | W-AVG-Lat | W-P99-Lat |
|---|---|---|---|---|---|---|---|---|
| Write | 3 * 15 | 0:1 | - | - | - | 56,953 | 787 | 1,786 |
| Read | 3 * 50 | 1:0 | 360,642 | 413 | 984 | - | - | - |
| Read & Write | 3 * 30 | 1:1 | 62,572 | 464 | 5,274 | 62,561 | 985 | 3,764 |
| Read & Write | 3 * 15 | 1:3 | 16,844 | 372 | 3,980 | 50,527 | 762 | 1,551 |
| Read & Write | 3 * 15 | 1:30 | 1,861 | 381 | 3,557 | 55,816 | 790 | 1,688 |
| Read & Write | 3 * 30 | 3:1 | 140,484 | 351 | 3,277 | 46,822 | 856 | 2,044 |
| Read & Write | 3 * 50 | 30:1 | 336,106 | 419 | 1,221 | 11,203 | 763 | 1,276 |
2.3.0
Test environment
Same as 2.4.0
Benchmark results
| Case | threads | Read/Write | R-QPS | R-AVG-Lat | R-P99-Lat | W-QPS | W-AVG-Lat | W-P99-Lat |
|---|---|---|---|---|---|---|---|---|
| Write | 3 * 15 | 0:1 | - | - | - | 42,386 | 1,060 | 6,628 |
| Read | 3 * 50 | 1:0 | 331,623 | 585 | 2,611 | - | - | - |
| Read & Write | 3 * 30 | 1:1 | 38,766 | 1,067 | 15,521 | 38,774 | 1,246 | 7,791 |
| Read & Write | 3 * 15 | 1:3 | 13,140 | 819 | 11,460 | 39,428 | 863 | 4,884 |
| Read & Write | 3 * 15 | 1:30 | 1,552 | 937 | 9,524 | 46,570 | 930 | 5,315 |
| Read & Write | 3 * 30 | 3:1 | 93,746 | 623 | 6,389 | 31,246 | 996 | 5,543 |
| Read & Write | 3 * 50 | 30:1 | 254,534 | 560 | 2,627 | 8,481 | 901 | 3,269 |
1.12.3
Test environment
Hardware
- CPU: Intel® Xeon® CPU E5-2620 v3 @ 2.40 GHz
- Memory: 128 GB
- Disk: SSD 480 GB * 8
- Network card: Bandwidth 10 Gb
Other testing environments are the same as 2.4.0
Benchmark results
- Single data size: 320B
| Case | threads | Read/Write | R-QPS | R-AVG-Lat | R-P99-Lat | W-QPS | W-AVG-Lat | W-P99-Lat |
|---|---|---|---|---|---|---|---|---|
| Read & Write | 3 * 15 | 0:1 | - | - | - | 41,068 | 728 | 3,439 |
| Read & Write | 3 * 15 | 1:3 | 16,011 | 242 | 686 | 48,036 | 851 | 4,027 |
| Read & Write | 3 * 30 | 30:1 | 279,818 | 295 | 873 | 9,326 | 720 | 3,355 |
- Single data size: 1KB
| Case | threads | Read/Write | R-QPS | R-AVG-Lat | R-P99-Lat | W-QPS | W-AVG-Lat | W-P99-Lat |
|---|---|---|---|---|---|---|---|---|
| Read & Write | 3 * 15 | 0:1 | - | - | - | 40,732 | 1,102 | 4,216 |
| Read & Write | 3 * 15 | 1:3 | 14,355 | 476 | 2,855 | 38,547 | 1,016 | 4,135 |
| Read & Write | 3 * 20 | 3:1 | 87,480 | 368 | 4,170 | 29,159 | 940 | 4,170 |
| Read & Write | 3 * 50 | 1:0 | 312,244 | 479 | 1,178 | - | - | - |
1.12.2
Test environment
The testing environment is the same as 1.12.3
Benchmark results
- Single data size: 320B
| Case | threads | Read/Write | R-QPS | R-AVG-Lat | R-P99-Lat | W-QPS | W-AVG-Lat | W-P99-Lat |
|---|---|---|---|---|---|---|---|---|
| Read & Write | 3 * 15 | 0:1 | - | - | - | 40,439 | 739 | 2,995 |
| Read & Write | 3 * 15 | 1:3 | 16,022 | 309 | 759 | 48,078 | 830 | 3,995 |
| Read & Write | 3 * 30 | 30:1 | 244,392 | 346 | 652 | 8,137 | 731 | 2,995 |
1.11.6
Test environment
- Test interfaces:
multi_get()andbatch_set() - A hashkey contains 3 sortkeys
- Single
batch_set()call will set 3 hashkeys - Single data size: 3KB
- The partitions count of the test table: 128
- rocksdb_block_cache_capacity = 40G
-
Other testing environments are the same as 1.12.3
-
Benchmark results
| Case | threads | Read/Write | duration | Max cache hit rate | R-QPS | R-AVG-Lat | R-P99-Lat | R-P999-Lat | W-QPS | W-AVG-Lat | W-P99-Lat | W-P999-Lat |
|---|---|---|---|---|---|---|---|---|---|---|---|---|
| Read & Write | 3 * 15 | 20:1 | 1 | 10% | 150K | 263 | 808 | 12,615 | 8k | 1,474 | 7,071 | 26,342 |
| Read & Write | 3 * 7 | 20:1 | 2 | 17% | 75K | 226 | 641 | 5,331 | 4K | 1,017 | 4,583 | 14,983 |
1.11.1
Test environment
The testing environment is the same as 1.12.3
Benchmark results
- Single data size: 20KB * 2 replicas
| Case | threads | Read/Write | duration | R-QPS | R-AVG-Lat | R-P99-Lat | W-QPS | W-AVG-Lat | W-P99-Lat |
|---|---|---|---|---|---|---|---|---|---|
| Write | 3 * 10 | 0:1 | 0.78 | - | - | - | 14,181 | 2,110 | 15,468 |
| Read & Write | 3 * 15 | 1:3 | 0.52 | 4,024 | 5,209 | 41247 | 12,069 | 1,780 | 14,495 |
| Read & Write | 3 * 30 | 30:1 | 0.76 | 105,841 | 816 | 9613 | 3,527 | 1,107 | 4,155 |
| Read | 6 * 100 | 1:0 | 1.04 | 162,150 | 1,868 | 6733 | - | - | - |
- Single data size: 20KB * 3 replicas
| Case | threads | Read/Write | duration | R-QPS | R-AVG-Lat | R-P99-Lat | W-QPS | W-AVG-Lat | W-P99-Lat |
|---|---|---|---|---|---|---|---|---|---|
| Write | 3 * 10 | 0:1 | 1.16 | - | - | - | 9,603 | 3,115 | 20,468 |
| Read & Write | 3 * 15 | 1:3 | 0.69 | 3,043 | 5,657 | 38,783 | 9,126 | 3,140 | 27,956 |
| Read & Write | 3 * 30 | 30:1 | 0.89 | 90,135 | 937 | 13,324 | 3,002 | 1,185 | 4,816 |
| Read | 6 * 100 | 1:0 | 1.08 | 154,869 | 1,945 | 7,757 | - | - | - |
- Single data size: 10KB * 2 replicas
| Case | threads | Read/Write | duration | R-QPS | R-AVG-Lat | R-P99-Lat | W-QPS | W-AVG-Lat | W-P99-Lat |
|---|---|---|---|---|---|---|---|---|---|
| Write | 3 * 10 | 0:1 | 0.78 | - | - | - | 14,181 | 2,110 | 15,468 |
| Read & Write | 3 * 15 | 1:3 | 0.52 | 4,024 | 5,209 | 41247 | 12,069 | 1,780 | 14,495 |
| Read & Write | 3 * 30 | 30:1 | 0.76 | 105,841 | 816 | 9613 | 3,527 | 1,107 | 4,155 |
| Read | 6 * 100 | 1:0 | 1.04 | 162,150 | 1,868 | 6733 | - | - | - |
- Single data size: 10KB * 3 replicas
| Case | threads | Read/Write | duration | R-QPS | R-AVG-Lat | R-P99-Lat | W-QPS | W-AVG-Lat | W-P99-Lat |
|---|---|---|---|---|---|---|---|---|---|
| Write | 3 * 10 | 0:1 | 1.16 | - | - | - | 9,603 | 3,115 | 20,468 |
| Read & Write | 3 * 15 | 1:3 | 0.69 | 3,043 | 5,657 | 38,783 | 9,126 | 3,140 | 27,956 |
| Read & Write | 3 * 30 | 30:1 | 0.89 | 90,135 | 937 | 13,324 | 3,002 | 1,185 | 4,816 |
| Read | 6 * 100 | 1:0 | 1.08 | 154,869 | 1,945 | 7,757 | - | - | - |
1.11.0
Test environment
The testing environment is the same as 1.12.3
Benchmark results
- Single data size: 320B
| Case | threads | Read/Write | duration | R-QPS | R-AVG-Lat | R-P99-Lat | W-QPS | W-AVG-Lat | W-P99-Lat |
|---|---|---|---|---|---|---|---|---|---|
| Write | 3 * 10 | 0:1 | 1.89 | - | - | - | 44,039 | 679 | 3,346 |
| Read & Write | 3 * 15 | 1:3 | 1.24 | 16,690 | 311 | 892 | 50,076 | 791 | 4,396 |
| Read & Write | 3 * 30 | 30:1 | 1.04 | 311,633 | 264 | 511 | 10,388 | 619 | 2,468 |
| Read | 6 * 100 | 1:0 | 0.17 | 978,884 | 623 | 1,671 | - | - | - |
| Read | 12 * 100 | 1:0 | 0.28 | 1,194,394 | 1,003 | 2,933 | - | - | - |
Benchmark in different scenarios
Unless otherwise specified, the testing environment is as follows:
- The testing environment is the same as 1.12.3
- Single data size: 1KB
- Client:
- Number of nodes: 3
- version: 1.11.10-thrift-0.11.0-inlined-release
- Server:
- Number of nodes: 5
- Version: 1.12.3
- The partitions count of the test table: 64
- 配置:
rocksdb_limiter_max_write_megabytes_per_sec = 500,rocksdb_limiter_enable_auto_tune = false
Cluster throughput capability
This test aims to compare the latency changes in the same cluster under different client request throughput.
NOTE: RocksDB rate-limiter is not enabled
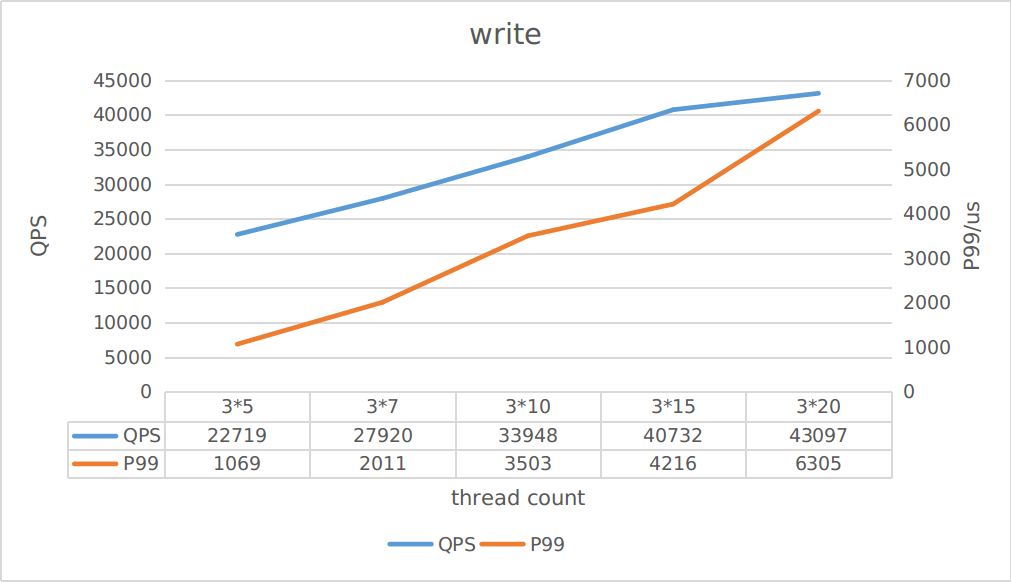
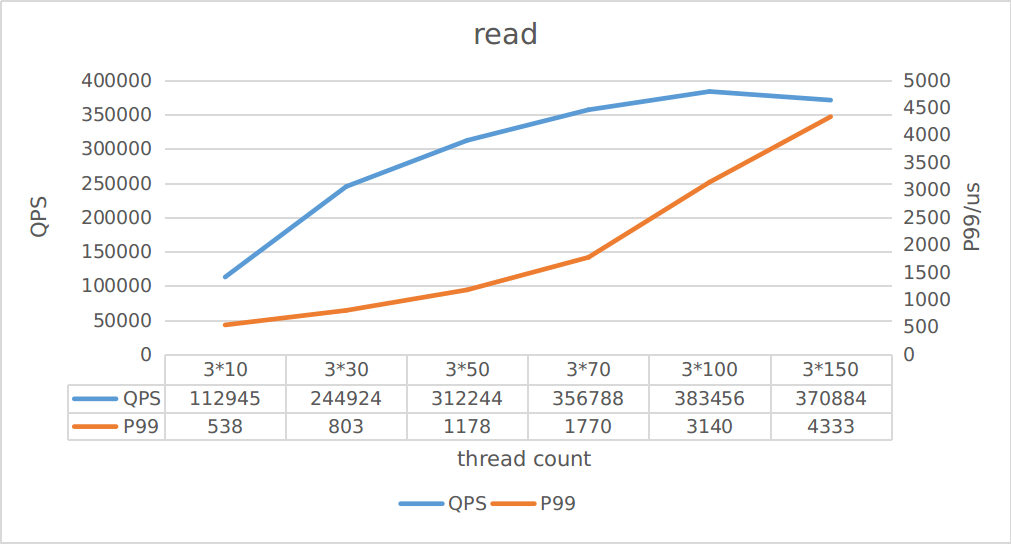
From the above figure, it can be seen that the maximum writing throughput is about 43K, and the maximum reading throughput is about 370K. You can estimate the corresponding latency based on reading/writing throughput.
Whether to enable RocksDB rate-limiter
The testing scenario: set
threadsas 3 * 20, with IPS of approximately 44K
Pegasus uses RocksDB as the storage engine, when write data accumulated, it will trigger more compaction operations, occupy more disk IO, and cause more long tails. This test demonstrates that after enabling the RocksDB rate-limiter, the compaction load can be reduced, significantly reducing the occurrence of long tails.
The following figures show the IO usage and P99 write latency for three scenarios:
rocksdb_limiter_max_write_megabytes_per_sec = 0rocksdb_limiter_max_write_megabytes_per_sec = 500androcksdb_limiter_enable_auto_tune = false-
rocksdb_limiter_max_write_megabytes_per_sec = 500androcksdb_limiter_enable_auto_tune = true -
Disk IO usage:
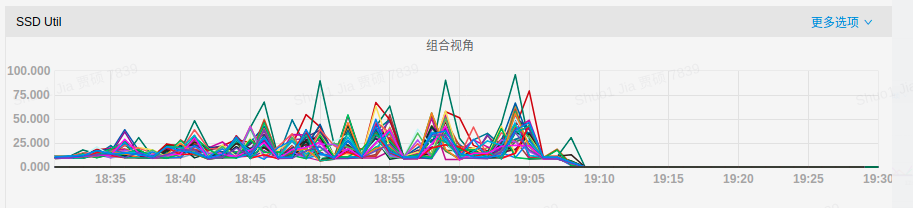
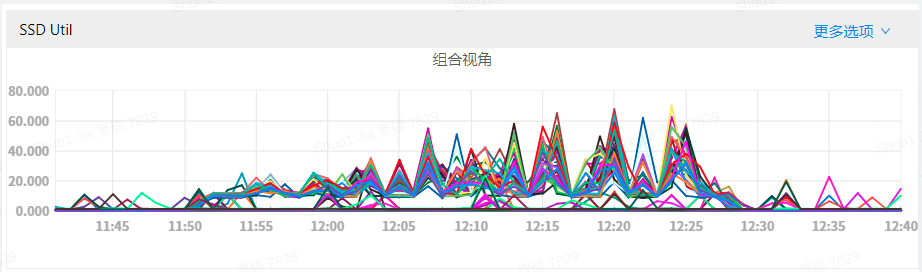
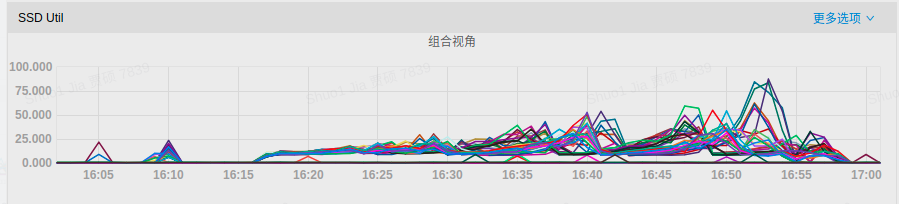
- P99 latency:
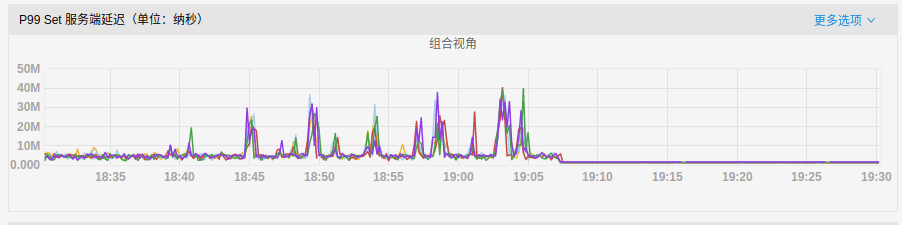
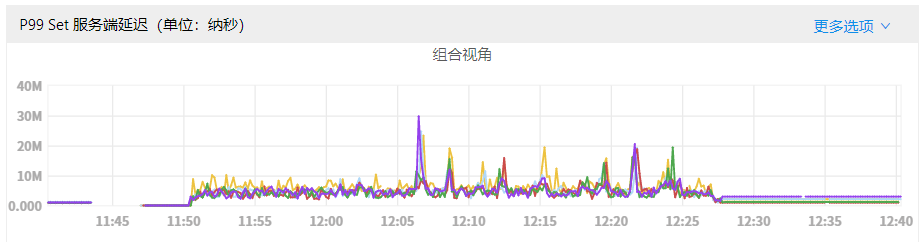
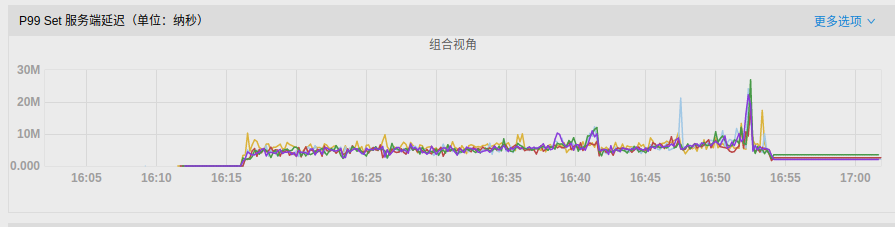
It can be observed that when RocksDB rate-limiter enabled, the disk IO utilization rate has been reduced, and write latency has also been greatly alleviated.
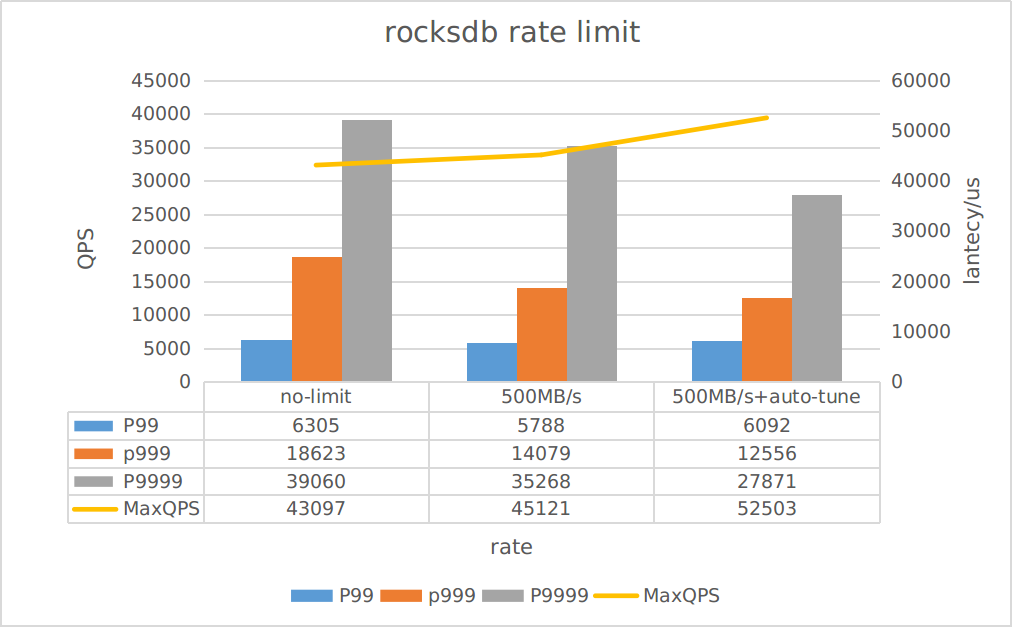 We obtained the results from YCSB benchmark:
- When rate-limiter enabled, the throughput increased by about 5%
- When both rate-limiter and auto-tune enabled, the throughput increased by about 20%
- When rate-limiter enabled, only the latency in extreme situations (P999/P9999) has a significant improvement, but the improvement is not significant for most requests
However, it should be noted that:
The auto-tune function may trigger write stall issues in scenarios which a single piece of data is larger, please evaluate whether to enable auto-tune reasonably in your environment.
Cluster scale
This test aims to observe the impact of different number of replica servers on read and write throughput.
The testing cases are read-only and write-only
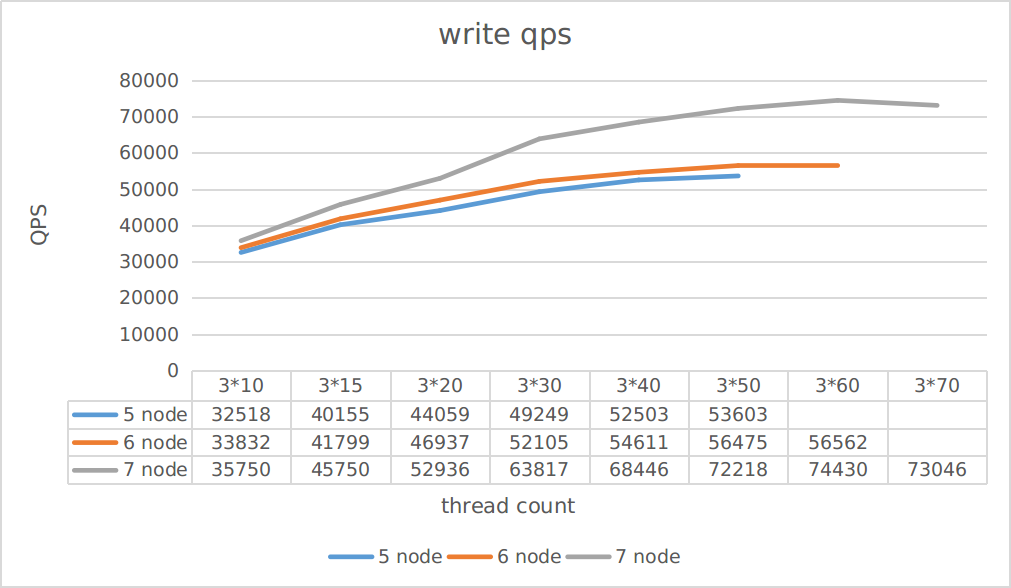
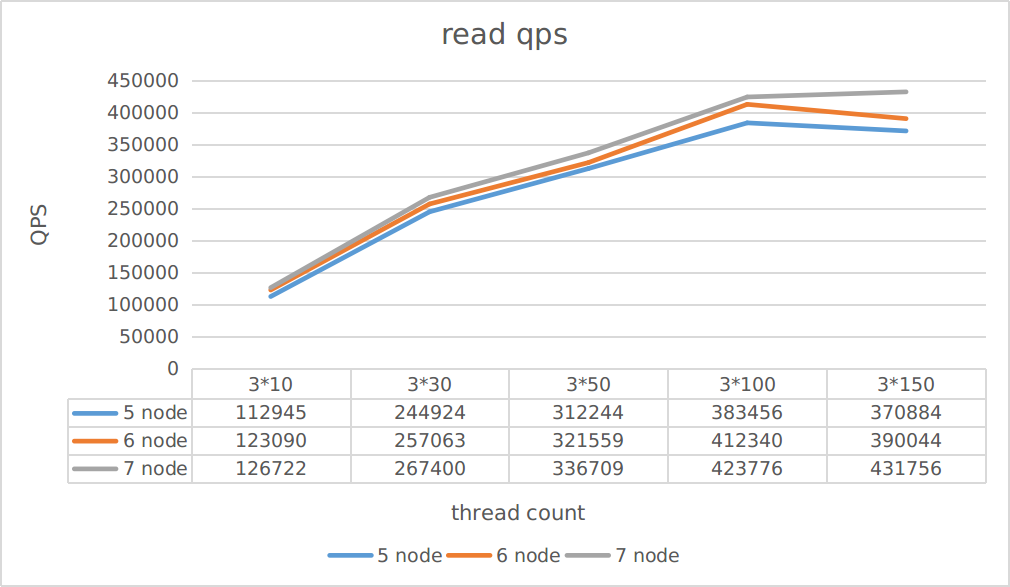
As can be seen from the figure:
- Write throughput improves more than read throughput when the cluster scales out
- The throughput is not improved linearly when the cluster scales out
You can reasonably estimate the throughput of a cluster in different scales based on this test.
Different partition count of table
This test aims to observe the impact of different partition count of a table on performance.
The testing scenario is: Only read:
threadsconfigured as 3 * 50 Only write:threadsconfigured as 3 * 40
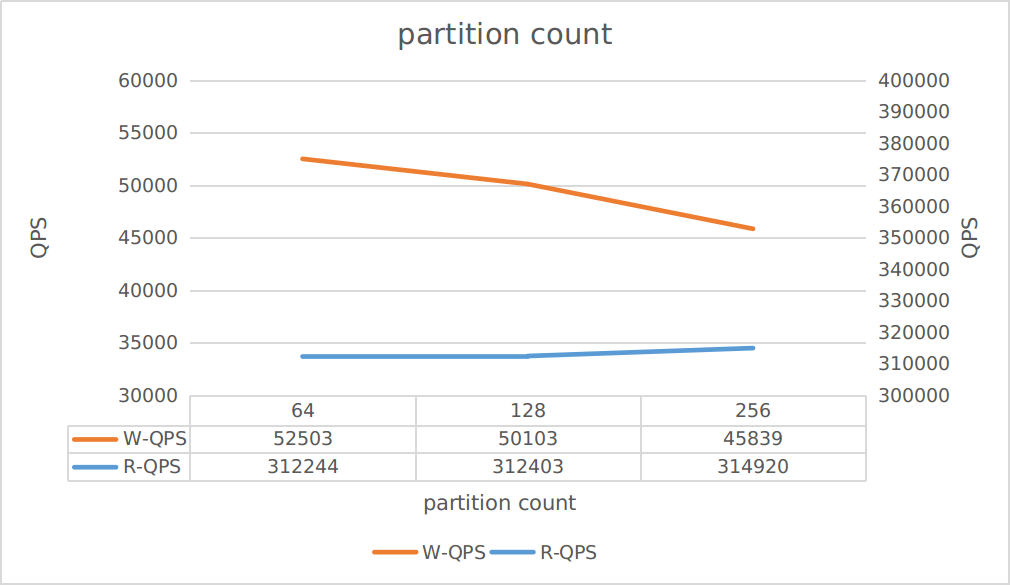
As can be seen from the figure:
- Increasing partition count can improve read throughput
- But it also reduces write throughput
Therefore, please evaluate the partition count according to your application requirements reasonably.
In addition, if the partition count is too small, it may cause issues such as large single partition and data skew between disks. In production environment, it is recommended to keep the size of a single partition less than 10GB if there are no special requirements.